by PHP-Editors staff, June 2013
A couple of weeks ago we received a newsletter from NuSphere with a mention of the upcoming version 10 of their flagman product PHP Editor - PhpED (http://www.nusphere.com/products/phped.htm). Newsletter had a link to the movie (http://www.nusphere.com/flash_files/js-debugging-v10.html) showing JavaScript debugger integration in the new version of the IDE and also said NuSphere was "bringing something
NOBODY else has". We watched the movie, like JS debugger integration a lot and certainly got intrigued about the mysterious feature. So we emailed NuSphere and simply asked for a preview of the PHP Editor. As it says ask and you shall receive - instead of the preview they gave us a beta version of the editor to review and simply wrote - look at the Sql Profiler. And so we did - here is a brief summary of what we think is a super awesome innovation in the new version of NuSphere's PHP IDE.
PhpED has always had a php profiler - the feature that allows you to find the bottlenecks in your php application and even shows the chart graph of performance profiles of your code - sorted by modules, functions or lines. To use it you need to setup PhpED php debugger, which is pretty easy and works for both local and remote projects, including even shared hosting like GoDaddy's offerings. We quickly setup the debugger in the IDE following the steps outlined in our article Debugging applications with PHP Editor/IDE in shared hosting (GoDaddy) using the same account of one of our staff editors on travel-circel.com.
Looks like upcoming version 10 gives PHP Profiler a new look and feel
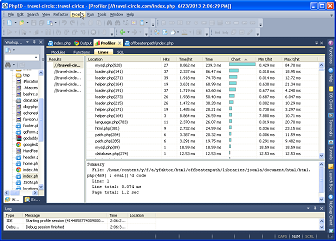
But the most interesting to us was the new menu item in the Profiler menu of the editor, called SQL Profiler.
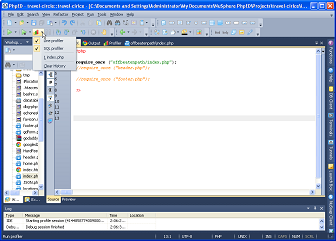
When checked it turns on the SQL profiling of PHP code. PhpED traces every call to one of the supported databases, makes a record of the query executed and the execution time.
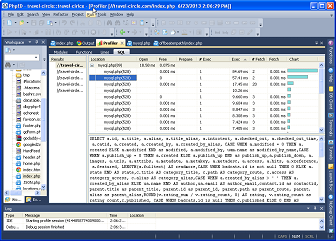
In the sql profiler you can see each of the sql queries executed in the session, broken down into open, prepare, execution and fetch results times and number of executions and fetches separately - with each column sortable and the bar chart column at the end with a pop-up menu allowing you to specify which column data should be used for the chart.
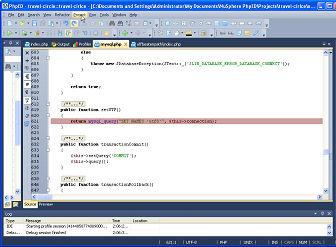
In the example above we got to see all of the crazy sql created and executed by Joomla in one simple request to open a page. Double clicking on the line in the profiler takes you right to the place in the source code where it is located:
Sorting on execution time column we can easily find the query that took the longest
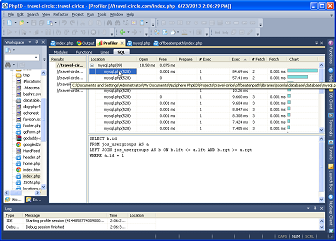
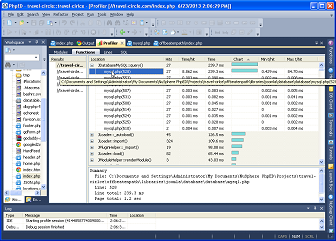
Checking on the other tabs of the profiler we can see that this is also the overall bottleneck of the request
We can equally easy find the query that was called the most
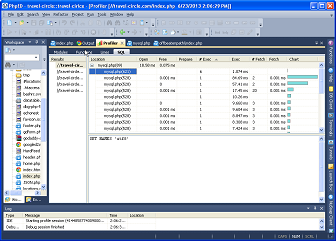
Which in general can help finding the calls that should be cached
In our opinion SQL Profiler in PhpED v10.0 - NuSphere's PHP Editor lives up to the promise of being something nobody else has in PHP IDE/Editors. It is a very powerful feature normally available from 3rd party services charging you north of $99/month for their subscriptions. Having it available in PHP Editor with one time purchase and also very aggressively priced, combined with the power of PHP Debugger and PHP Editor's code intellisense will make the lives of PhpED users much easier. NuSphere told us that SQL Profiler will be included in both Professional and Personal editions and even though integrated JS Debugger and SQL Profiler are no longer a secret we also saw other enhancements there that we are not allowed to review just yet - all that's left now is to wait for PhpED V10.0 official shipment. We hear it is happening very soon.

